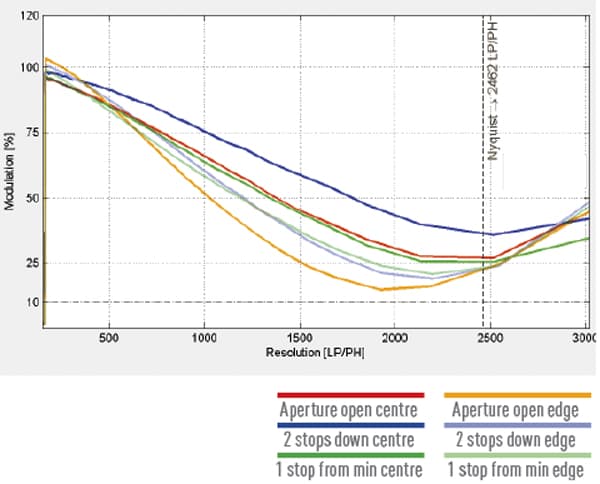
Resolution

The MTF resolution chart shows clarity on the vertical axes and the number of line pairs per picture height (lp/ph) on the horizontal. As the lp/ph increases, the lens is less able to define them, hence the typical downward curve of an MTF chart.
Shading

To show vignetting, we use a 3D rendering. The brightest part of the lens, in the centre, is measured at 0EV. As the edges get darker, the corners drop, representing the scale of the darkening. A 1EV difference in brightness is shown in red.
Curvilinear distortion

The red arrows on the distortion grid show the direction and strength of the shift in the image, compared to the original point on the photographed chart. The Mean and Max values are given to show the average and worst point shift as a percentage value.

Our cameras and lenses are tested using the industry-standard Image Engineering IQ-Analyser software. Visit www.image-engineering.de for more details.


